The first tiny program I worked on for Code Doodle was a list difference calculator. It takes two lists and tells you which elements are on both lists or how similar the lists they are.
I made this mostly to back up my joke that every time you watch any World Cup coverage an English sportscaster will talk about 1966 and how well the English team has done against whoever they're playing since then, despite the fact that ... none of the players are the same. Similarly the record of two NHL teams must be discussed even when there are more players who are playing for the other team than played for the same team after some period of time. I thought having a program which backs up how ridiculous these types of statements are might be entertaining. As it happens, I also ran into a problem at work that needed me to find which people were on two lists, so it's not just a joke, but it's still mostly a joke.
All this program does is calculate the union, intersection and set difference for the two lists and then calculate how similar the two lists are. This is a bit messy in Java, due to the limitations of the Java Collections API (certainly the Python version of this program would be tiny), but nothing particularly hard to do. It was a fun project, so I wrote it up, wrote up some basic tests, and it seemed good enough.
Later on, when I was adding in the ability to read from a file, I put in two lists that were different than my original lists and thought I must have made a mistake. Even though I thought the two lists should be 50% similar, the program told me that they were 33% similar.
So I went and checked through my code, my tests and my math. All of those were correct, as for as I could see, so I did what naturally comes next, I asked Google. After a few journeys through Stack Overflow and Wikipedia I managed to get something of an answer. I'm not weird, math is weird.
Well, I am weird and math is weird.
Different Types of Set Similarity
My intuition when I was writing the program said to me that the similarity of two sets would be the size of the intersection of those sets, divided by the size of the union. If there are 10 total things and 3 of them are on both lists then the two lists should are 30% similar.
The problem came for me looking at two sets like this:
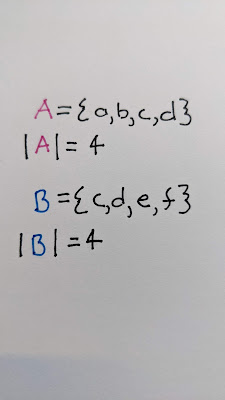
{a, b, c, d} and {c, d, e, f}
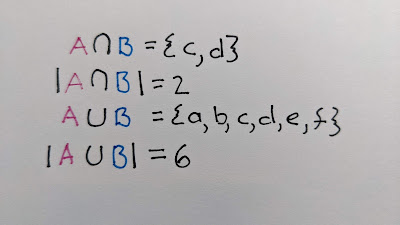
The intersection {c, d} has 2 elements and the union has 6 elements {a, b, c, d, e, f}, so by my reckoning above, the two sets are 33% similar. When I came back to it, my intuition said since each list has half unique elements and half common they should be 50% similar. So I had two "intuitive" results, both of which seemed to be mathematically correct, but which "felt" right in different contexts.
I should probably have done some reading first, but this wasn't a reading first kind of project. Once I did start reading I was at least pleased to discover that I'd done my math right.
Jaccard Coefficient
For my first calculation of similarity, I had stumbled upon the Jaccard coefficient (or the Jaccard index), which is the ratio of the size of the intersection to the size of the union.
The Jaccard Coefficient has you figure out the percentage of elements that are in both sets out of the all of the possible elements. This makes sense for a lot of sense for a lot of applications, for example if you want to see how similar two photos are for example you can see how many of the pixels are the same and the more similar pixels the more similar the photos should be. Because it focuses on on the intersection compared to all elements it makes the most sense when you're considering the whole space of the elements, rather than a specific set of those elements.
The problem here is that it doesn't suit my primary goal, which is to be able say that 22% of the 2014 English Men's football team returned to play in the 2018 English Men's football team. Instead the Jaccard coefficient tells me me that 5 out of the 44 people who played football for England in 2014 and 2018 played in both.So while it's an accurate measure of similarity for a lot of purposes, it doesn't tell us as much about the overlap between the two sets we're looking at.
Sørensen–Dice coefficient
I learned all that about the Jaccard Similarity while I started searching for the "right answer". Did I do the math wrong? No. Did I build a meaningless measure? Not that either. Thankfully after that I found the Wikipedia entry that introduced the Sørensen–Dice coefficient. For Sørensen–Dice, instead of looking at the elements in the intersection compared to all the elements, we're looking at the size of the intersection compared to the average size of the two sets.
Since we're now saying that 2 out of the 4 elements in either of the sets are the same, we get much closer to that feeling I was looking for. Now if we have 5 out of the 22 members on the 2014 English Men's football team repeat as 5 out of the 22 members on the 2018 English Men's football team, then the two teams are 22 % similar, as opposed to the 12% Jaccard would suggest.
For our example we now have 2 of the 4 in each set so a 50% similarity as opposed to the 33% similarity from the Jaccard coefficient and I think this produces a more intuitive measure for the kind of application I'm intending here.
Szymkiwicz-Simpson Coefficient
While I was at it, I also discovered the Szymkiwicz-Simpson coefficient, which is also called the Overlap coefficient. This is almost the same as the Sørensen–Dice coefficient, but instead of - effectively - looking at the average size, we're comparing the size of the intersection to the size of the smaller set. This reframes the question a little bit into how much of the smaller set appears in the larger set.
The big difference between Szymkiwicz-Simpson and Sørensen–Dice is that for sets with a large size difference the Sørensen–Dice will be higher. So the focus (as the name Overlap implies) is really focused on the overlap vs the overall similarity. Since for most of the data I'm playing with, the two sets are pretty similar in size there's really no effective difference between the two, but I'm sure in different applications, the difference might be really helpful. (For example: Is it more remarkable that two people were both in classes of 100, or more remarkable that they were in a class of 100 and a class of 10?)
If we take the same basic set of six elements and slightly reorganize the two sets we're comparing we can see real differences in the outcomes.
Feelings about Set Similarity
In short this is a silly project. It is entirely based out of me having listened to too many sports-casters say dumb statistical things. (Don't get me started on the "Data Science" of restricting events to such a ridiculous extent that you can find the most shots made by a left-handed player in the odd minutes of the second half of a game.)
I'm sure in *most* applications of similarity measures, there's something which will indicate what the right measure is for the application. Jaccard and Sørensen where both working in ecology and populations (and I think Szymkiwicz was as well) and so depending on what question they were looking at, the both make sense for comparing different populations. In computer vision, Jaccard makes a lot of sense for checking if two images are the same, but Szymkiwicz might make more sense to see if a smaller picture is part of a bigger one.
For my purposes, the primary answer is feel. Does it feel like the 2014 English Mens football team is more similar to the 2018 or the 2010? So even while math might leave me to lean on Jaccard, the other two feel like a better fit.
I actually ran a twitter poll on the topic (and thank you to all 5 people who answered ... it was a weird poll).
Weird question, but given these two sets, how similar do they *feel* mathematically.
— Dr. TJ Kendon (@tjkendon) January 11, 2022
X = {a, b, c, d}
Y = {c, d, e}
The results of the poll showed a split and I can't say anything at all other than to suggest that depending on your background and your purpose the way these measure "feel" is different. So when you're writing a program or analyzing data, it's worth thinking about how someone looking at your output is going to feel when the look at your results. Are they going to align with how they think about the problem and how they think about the data?
For my list difference calculator, I decided to avoid making a decision and added the options to calculate any of these three different similarity measures.


No comments:
Post a Comment